⎈ A Hands-On Guide to Kubernetes Logging Using ELK Stack & Filebeat ⚙️
⇢ A Comprehensive Guide to Setting Up the ELK Stack on Kubernetes with Helm with Practical Example
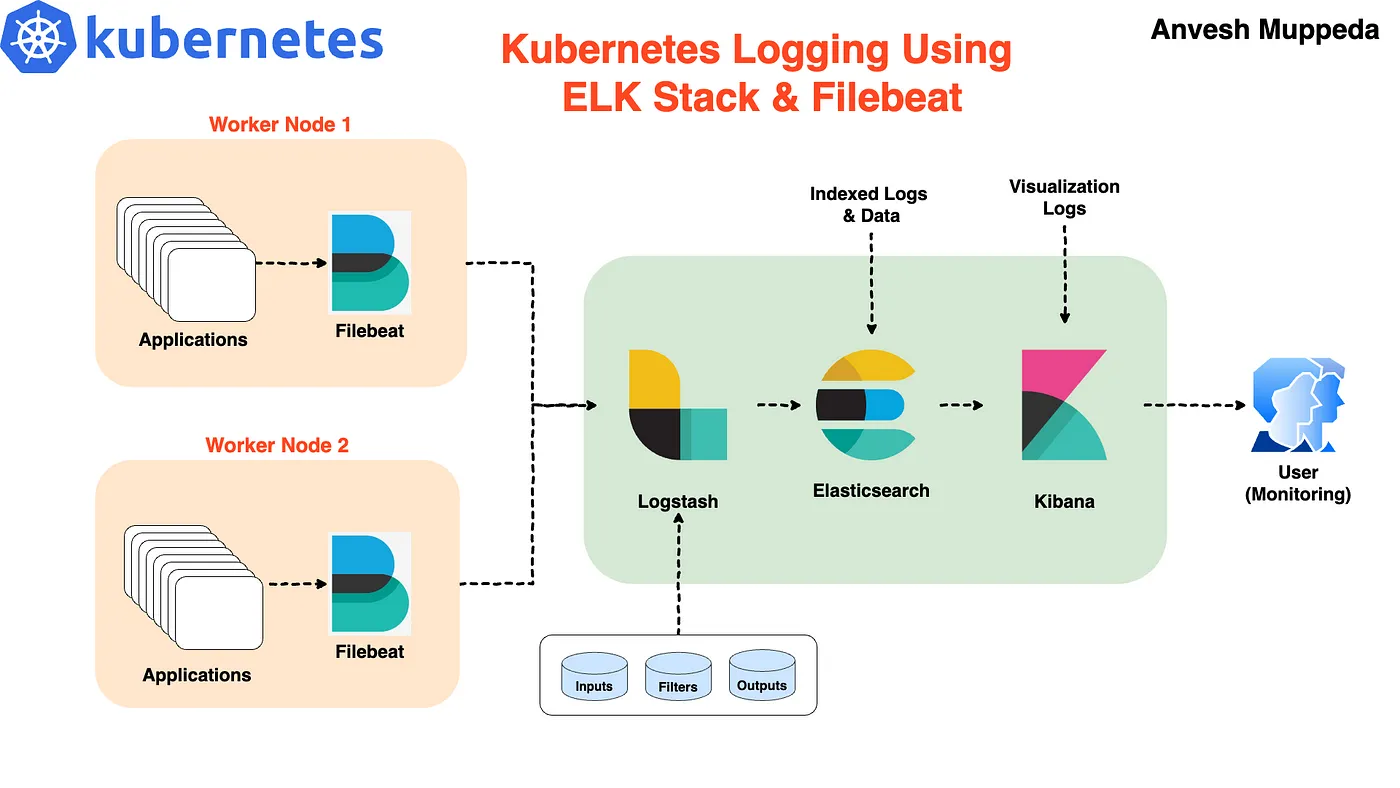
In this blog post, we’ll guide you through setting up the ELK stack (Elasticsearch, Logstash, and Kibana) on a Kubernetes cluster using Helm. Helm simplifies the deployment and management of applications on Kubernetes, making it an excellent tool for deploying complex stacks like ELK. We’ll also configure Filebeat to collect and forward logs to Logstash.
Prerequisites
Before we get started, make sure you have:
-
A Kubernetes cluster up and running.
-
Helm installed and configured.
-
kubectl installed and configured.
Step 1: Install Elasticsearch
Elasticsearch is the core component of the ELK stack, responsible for storing and indexing logs. We’ll use the official Elasticsearch Helm chart for deployment.
- Add the Elastic Helm repository:
helm repo add elastic https://helm.elastic.co
helm repo update
- Create a elasticsearch-values.yaml file with the following content:
resources:
  requests:
    cpu: "200m"
    memory: "200Mi"
  limits:
    cpu: "1000m"
    memory: "2Gi"

antiAffinity: "soft"
antiAffinity: "soft": Configures soft anti-affinity, allowing pods to be scheduled on the same node if necessary, but preferring to spread them across nodes when possible.
- Install Elasticsearch:
helm install elasticsearch elastic/elasticsearch -f elasticsearch-values.yaml
This command installs Elasticsearch with the specified configurations.
Step 2: Configure and Install Filebeat
Filebeat is a lightweight shipper for forwarding and centralizing log data. We’ll configure Filebeat to collect logs from containerized applications and forward them to Logstash.
- Create a filebeat-values.yaml file with the following content:
filebeatConfig:
  filebeat.yml: |
    filebeat.inputs:
    - type: container
      paths:
        - /var/log/containers/*.log
      processors:
      - add_kubernetes_metadata:
          host: ${NODE_NAME}
          matchers:
          - logs_path:
              logs_path: "/var/log/containers/"

  output.logstash:
    hosts: ["logstash-logstash:5044"]
Explanation:
filebeat.inputs: Configures Filebeat to collect logs from container directories. The path /var/log/containers/*.log is where Kubernetes stores container logs.
processors: Adds Kubernetes metadata to the logs to provide context, such as pod names and namespaces.
output.logstash: Configures Filebeat to send logs to Logstash at port 5044.
- Install Filebeat using Helm:
helm install filebeat elastic/filebeat -f filebeat-values.yaml
This command installs Filebeat with the specified configuration, ensuring that logs are collected from containers and forwarded to Logstash.
Step 3: Configure and Install Logstash
Logstash processes and transforms logs before indexing them in Elasticsearch. We’ll set up Logstash to receive logs from Filebeat and send them to Elasticsearch.
- Create a logstash-values.yaml file with the following content:
extraEnvs:
  - name: "ELASTICSEARCH_USERNAME"
    valueFrom:
      secretKeyRef:
        name: elasticsearch-master-credentials
        key: username
  - name: "ELASTICSEARCH_PASSWORD"
    valueFrom:
      secretKeyRef:
        name: elasticsearch-master-credentials
        key: password

logstashConfig:
  logstash.yml: |
    http.host: 0.0.0.0
    xpack.monitoring.enabled: false

logstashPipeline:
  logstash.conf: |
    input {
      beats {
        port => 5044
      }
    }

    output {
      elasticsearch {
        hosts => ["https://elasticsearch-master:9200"]
        cacert => "/usr/share/logstash/config/elasticsearch-master-certs/ca.crt"
        user => '${ELASTICSEARCH_USERNAME}'
        password => '${ELASTICSEARCH_PASSWORD}'
      }
    }

secretMounts:
  - name: "elasticsearch-master-certs"
    secretName: "elasticsearch-master-certs"
    path: "/usr/share/logstash/config/elasticsearch-master-certs"

service:
  type: ClusterIP
  ports:
    - name: beats
      port: 5044
      protocol: TCP
      targetPort: 5044
    - name: http
      port: 8080
      protocol: TCP
      targetPort: 8080

resources:
  requests:
    cpu: "200m"
    memory: "200Mi"
  limits:
    cpu: "1000m"
    memory: "1536Mi"
Explanation:
extraEnvs: Sets environment variables for Elasticsearch authentication using Kubernetes secrets.
logstashConfig: Configures Logstash settings, including enabling HTTP and disabling monitoring.
logstashPipeline: Configures Logstash to listen on port 5044 for incoming logs from Filebeat and forward them to Elasticsearch.
secretMounts: Mounts the Elasticsearch CA certificate for secure communication between Logstash and Elasticsearch.
service: Configures Logstash’s service type as ClusterIP, making it accessible only within the cluster.
- Install Logstash using Helm:
helm install logstash elastic/logstash -f logstash-values.yaml
This command installs Logstash with the specified configuration, ensuring that it can receive logs from Filebeat and forward them to Elasticsearch.
Step 4: Configure and Install Kibana
Kibana provides a user interface for visualizing and interacting with Elasticsearch data.
- Create a kibana-values.yaml file with the following content:
service:
  type: NodePort
  port: 5601

resources:
  requests:
    cpu: "200m"
    memory: "200Mi"
  limits:
    cpu: "1000m"
    memory: "2Gi"
Explanation:
service.type: NodePort: Exposes Kibana on a specific port on all nodes in the Kubernetes cluster. This makes it accessible from outside the cluster for development and testing purposes.
port: 5601: The default port for Kibana, which is exposed for accessing the Kibana web interface.
- Install Kibana using Helm:
helm install kibana elastic/kibana -f kibana-values.yaml
This command installs Kibana with the specified configuration, allowing you to access it through the exposed port.
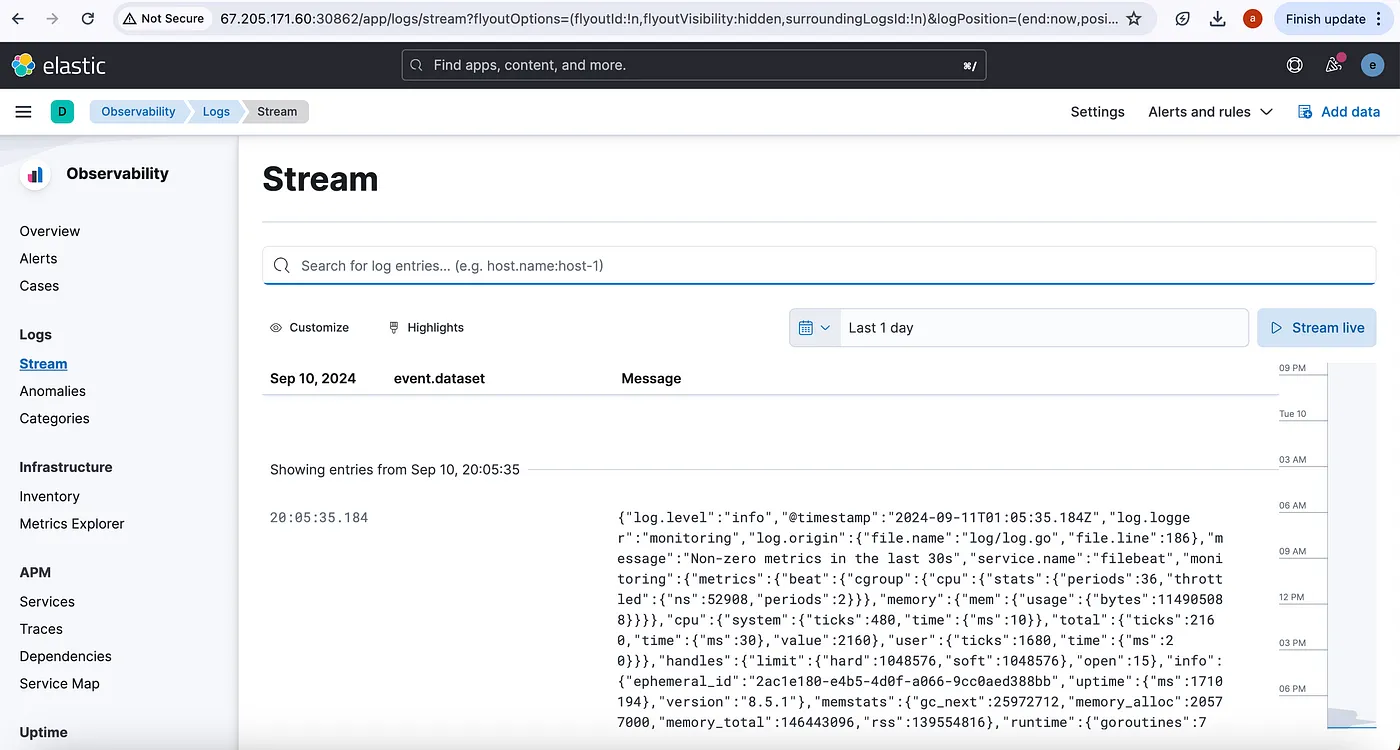
Step 5: Access Kibana and View Logs
Now that Kibana is installed and running, you can access it to visualize and analyze the logs collected by Filebeat and processed by Logstash.
- Find the NodePort assigned to Kibana:
kubectl get svc kibana-kibana -n elk -o jsonpath="{.spec.ports[0].nodePort}"
This command retrieves the NodePort assigned to Kibana, which you will use to access the Kibana web interface.
- Access Kibana:
Open your web browser and navigate to:
http://<EXTERNAL-IP>:<NODE-PORT>
Replace EXTERNAL-IP with the IP address of your Kubernetes cluster and NODE-PORT with the NodePort value obtained in step 1.
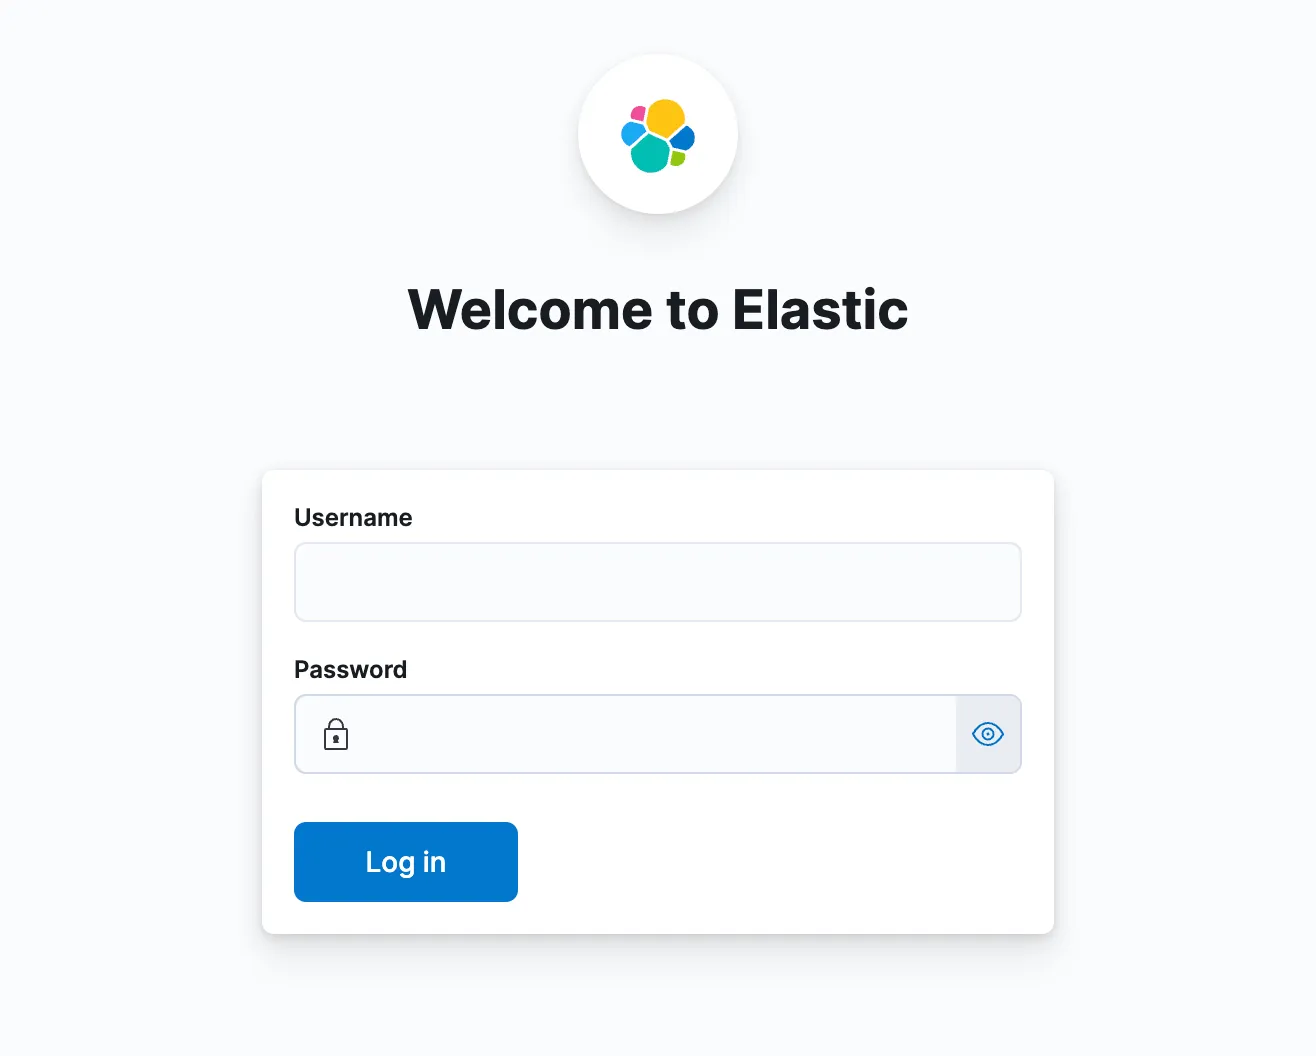
- Log in to Kibana:
You can get the login credentials for Kibana from the elastic secrets using the below commands.
$ kubectl get secret elasticsearch-master-credentials -o jsonpath="{.data.username}" | base64 --decode

$ kubectl get secret elasticsearch-master-credentials -o jsonpath="{.data.password}" | base64 --decode
Once you access Kibana, you can start exploring your log data.
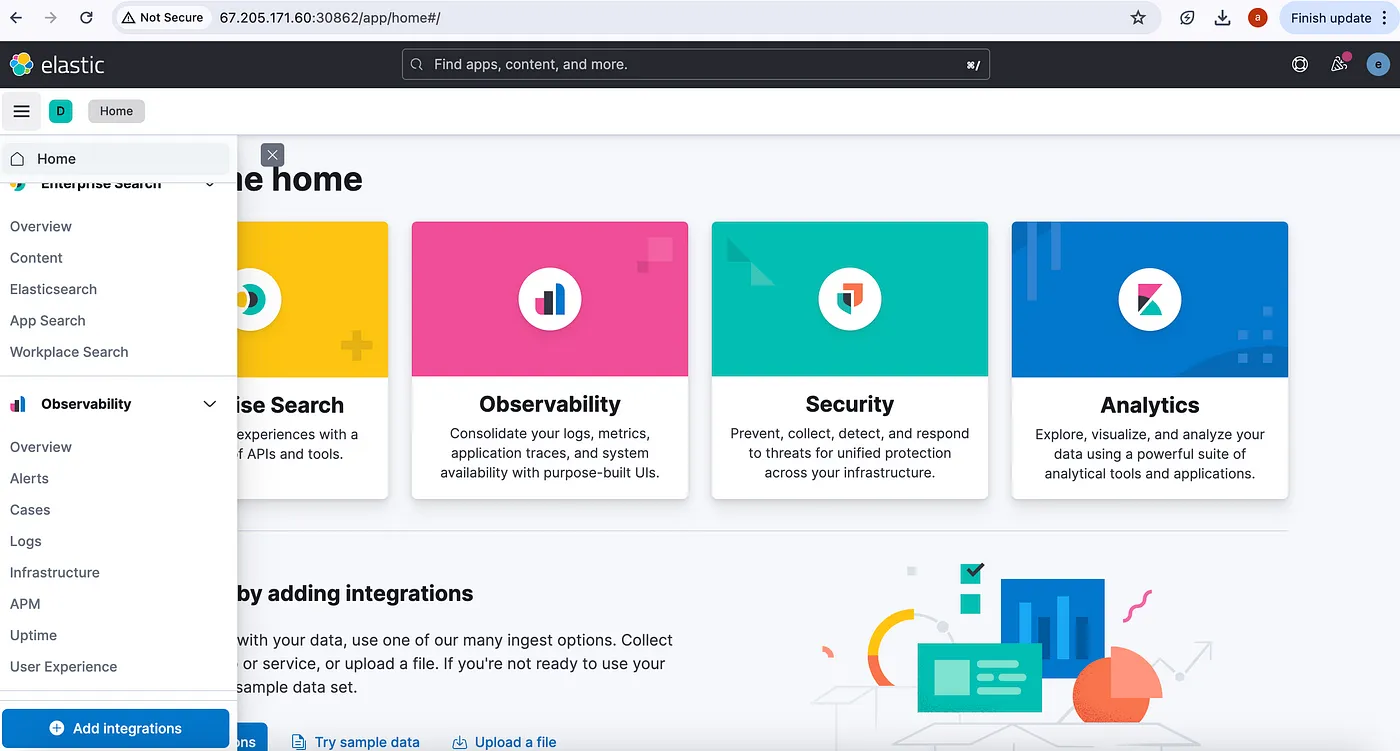
Access the logs
Step 6: Check Elasticsearch Cluster Health
To ensure that your Elasticsearch cluster is functioning correctly, you need to verify its health. Here’s how you can check the health of your Elasticsearch cluster:
Check Cluster Health:
Execute the below command to check the health of your Elasticsearch cluster by querying the _cluster/health endpoint:
kubectl exec -it <elasticsearch-pod-name or any-other-pod> -- curl -XGET -u elastic -vk 'https://elasticsearch-master:9200/_cluster/health?pretty'
Output:
$ kubectl exec -it elasticsearch-master-0 -- curl -XGET -u elastic -vk 'https://elasticsearch-master:9200/_cluster/health?pretty'

Defaulted container "elasticsearch" out of: elasticsearch, configure-sysctl (init)
Enter host password for user 'elastic':
Note: Unnecessary use of -X or --request, GET is already inferred.
*   Trying 10.245.158.126:9200...
* TCP_NODELAY set
* Connected to elasticsearch-master (10.245.158.126) port 9200 (#0)
* ALPN, offering h2
* ALPN, offering http/1.1
* successfully set certificate verify locations:
*   CAfile: /etc/ssl/certs/ca-certificates.crt
  CApath: /etc/ssl/certs
* TLSv1.3 (OUT), TLS handshake, Client hello (1):
* TLSv1.3 (IN), TLS handshake, Server hello (2):
* TLSv1.3 (IN), TLS handshake, Encrypted Extensions (8):
* TLSv1.3 (IN), TLS handshake, Certificate (11):
* TLSv1.3 (IN), TLS handshake, CERT verify (15):
* TLSv1.3 (IN), TLS handshake, Finished (20):
* TLSv1.3 (OUT), TLS change cipher, Change cipher spec (1):
* TLSv1.3 (OUT), TLS handshake, Finished (20):
* SSL connection using TLSv1.3 / TLS_AES_256_GCM_SHA384
* ALPN, server did not agree to a protocol
* Server certificate:
*  subject: CN=elasticsearch-master
*  start date: Sep 11 00:42:27 2024 GMT
*  expire date: Sep 11 00:42:27 2025 GMT
*  issuer: CN=elasticsearch-ca
*  SSL certificate verify result: unable to get local issuer certificate (20), continuing anyway.
* Server auth using Basic with user 'elastic'
> GET /_cluster/health?pretty HTTP/1.1
> Host: elasticsearch-master:9200
> Authorization: Basic ZWxhc3RpYzp6a3J6Z2lqd3NDUWlLaDJW
> User-Agent: curl/7.68.0
> Accept: */*
>
* TLSv1.3 (IN), TLS handshake, Newsession Ticket (4):
* Mark bundle as not supporting multiuse
< HTTP/1.1 200 OK
< X-elastic-product: Elasticsearch
< content-type: application/json
< content-length: 468
<
{
  "cluster_name" : "elasticsearch",
  "status" : "green",
  "timed_out" : false,
  "number_of_nodes" : 3,
  "number_of_data_nodes" : 3,
  "active_primary_shards" : 13,
  "active_shards" : 26,
  "relocating_shards" : 0,
  "initializing_shards" : 0,
  "unassigned_shards" : 0,
  "delayed_unassigned_shards" : 0,
  "number_of_pending_tasks" : 0,
  "number_of_in_flight_fetch" : 0,
  "task_max_waiting_in_queue_millis" : 0,
  "active_shards_percent_as_number" : 100.0
}
* Connection #0 to host elasticsearch-master left intact
Review the output to understand the cluster’s health status.
Conclusion
You’ve now set up the ELK stack on Kubernetes using Helm with the provided configurations! Your setup includes Elasticsearch for storing and indexing logs, Logstash for processing and forwarding logs, Filebeat for collecting and shipping logs, and Kibana for visualizing and analyzing your data. This powerful stack will help you monitor and analyze logs from your containerized applications.
Feel free to customize these configurations based on your specific requirements and environment. Happy logging!